Video Conferencing Tools Compared: How Much Energy Do Zoom, Teams, and FaceTime Really Use?
Video conferencing has become an integral part of our everyday lives. But how climate-friendly are tools like Zoom, Teams, and FaceTime really? In a self-experiment, all three tools were tested under identical conditions – with some surprising results.
This wasn’t just about the tools themselves, but also about a central question: Can the energy consumption of digital applications be measured and compared with simple methods? The answer is: Yes. Using the built-in powermetrics tool available on every Mac and some scripting in Python, a realistic test setup was created. It shows that even without expensive hardware or specialized software, meaningful energy comparisons are possible. The experiment proves that solid insights into energy efficiency can be achieved in a low-threshold and reproducible way – an important aspect for IT professionals who take sustainability seriously in their digital infrastructure.
Setup and Objective
The self-experiment was conducted in June/July 2023 on a MacBookPro17,1 running macOS Ventura Version 13.3. Only the energy consumption on the device itself was considered – meaning the energy demand of each application on the MacBook, excluding network usage or external infrastructure. The three widely used video conferencing tools Zoom, Microsoft Teams, and FaceTime were tested. The goal was to examine how incoming and outgoing video and screen sharing impact energy consumption – and whether recommendations for more sustainable usage can be derived.
At the same time, the experiment aimed to demonstrate that tools like powermetrics, a Python script, and a well-designed test setup can already be used to make qualitative statements about energy efficiency.
Methodology
Each tool was tested in various scenarios: incoming video on/off, outgoing video on/off, and screen sharing on/off. The so-called Energy Impact was recorded – a model value generated by powermetrics and saved as a text file. A restart was performed before each measurement series to terminate unnecessary processes. Additionally, a baseline was established by modeling the Energy Impact after a restart with no programs open.
Measurements were conducted in 10-minute blocks. Each scenario was repeated three times, and the average Energy Impact was calculated.
The analysis script was written in Python: relevant data was extracted using regex, transferred to a Pandas DataFrame, and visualized.
The test setup was intentionally kept realistic: video calls were conducted between two laptops. An external display showed a standardized test video with audio, which was recorded by the MacBook’s camera. This ensured that all scenarios were consistent and reproducible.
Results Overview
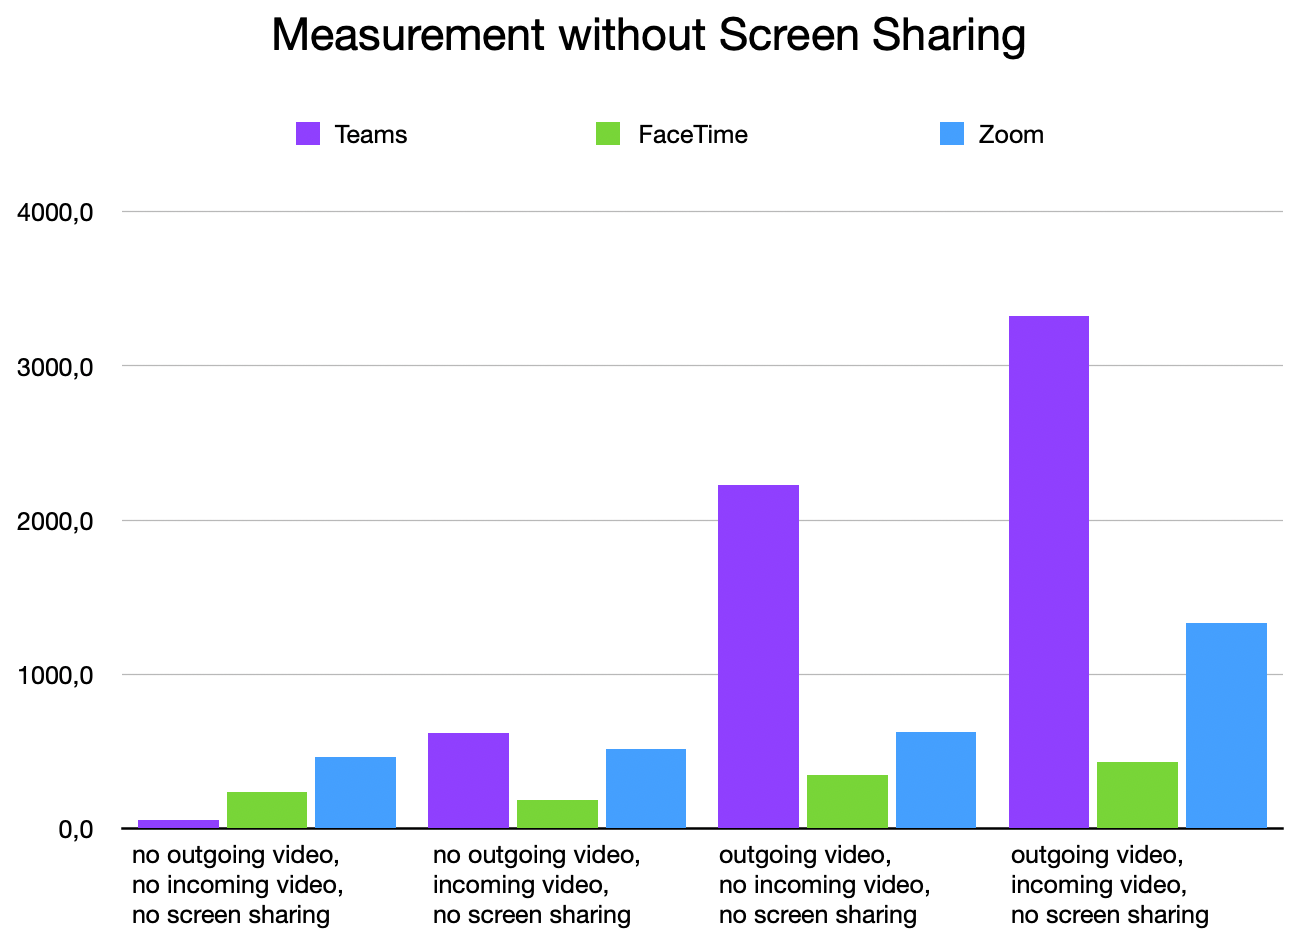
The two charts below clearly show the average Energy Impact of the tested video conferencing tools in two groups of scenarios: with and without screen sharing. This makes it easy to visually compare the energy profiles of the applications.
The results reveal clear differences between the tools – especially with screen sharing and active video. Microsoft Teams performed worse in almost all scenarios compared to Zoom and FaceTime. Only in the minimal mode without video or screen sharing were the results across all tools relatively similar.
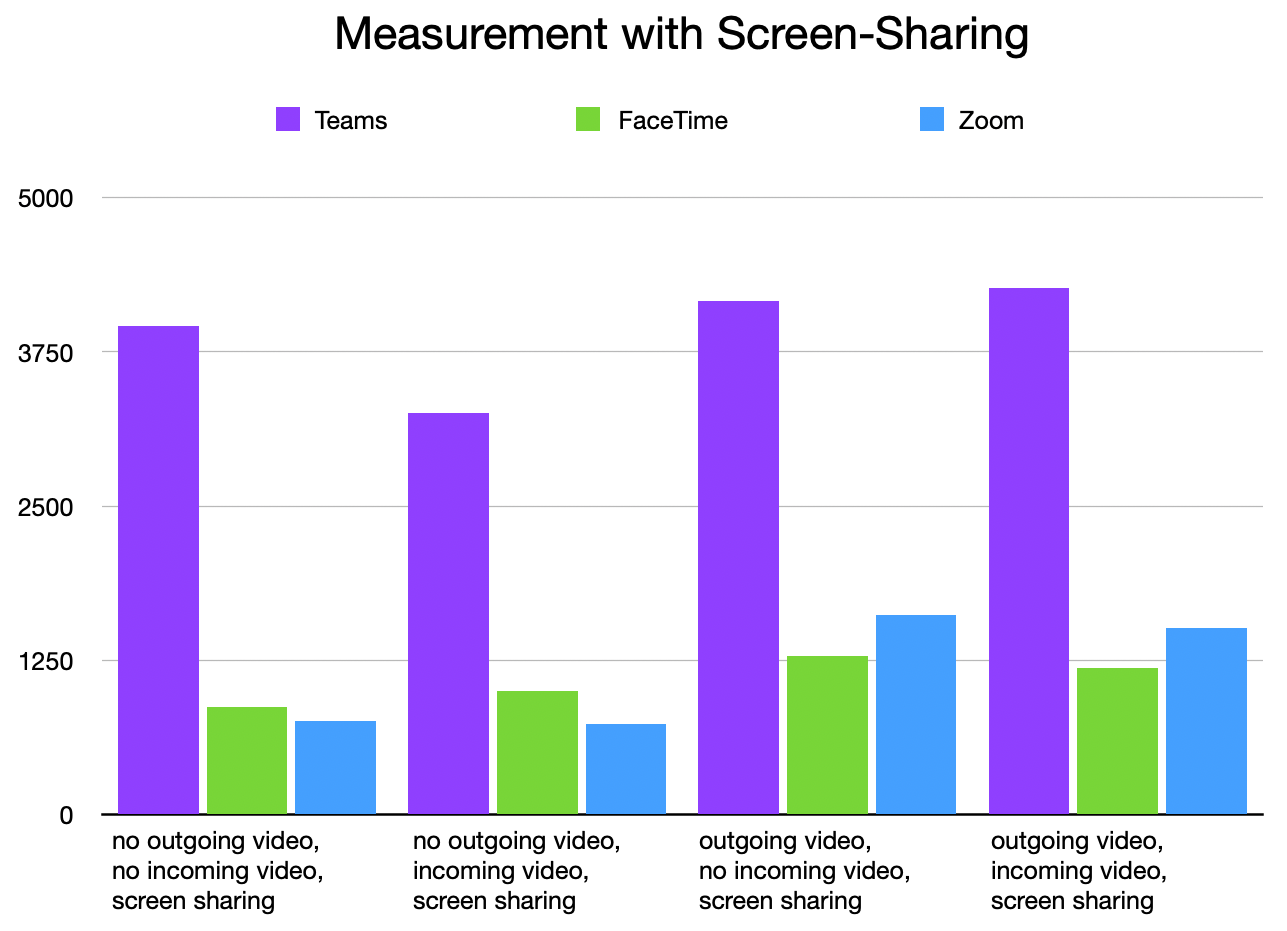
These data clearly show: The choice of tool and video conference configuration has a direct impact on energy consumption. Especially for regular meetings, it’s worth being mindful about camera and screen sharing behavior – particularly when using Teams.
A particularly revealing comparison is between the “everything off” and “everything on” scenarios. While FaceTime and Zoom showed almost identical values with only incoming or outgoing video compared to the “everything off” scenario, Microsoft Teams showed a dramatic difference: Energy Impact increased by a factor of 80 when all features – incoming and outgoing video and screen sharing – were enabled. In comparison: FaceTime’s consumption only increased by about a factor of five, Zoom by a factor of three. This not only highlights the technical efficiency of each platform, but also the immense potential for optimization through conscious use.
In the scenario with all features enabled (“Video in/out + screen sharing on”), the Energy Impact for Teams was about three times higher than in minimal mode with everything disabled – a significant difference that adds up over time.
Conclusion: Understanding Energy Use – A Foundation for Sustainable Software
The self-experiment shows just how wide the differences in energy consumption between video conferencing tools can be. Even with basic built-in tools, meaningful results can be achieved. This approach makes it possible to gradually engage with the complex topic of software energy efficiency – without immediately needing specialized measurement equipment or large resources.
The insights gained provide a solid foundation for evaluating software in terms of energy efficiency – and build a bridge to the Software Carbon Intensity (SCI) standard, which focuses on the transparent measurement and optimization of CO₂ emissions from software.
With the right tool and more conscious usage, even everyday applications can be used more sustainably.
For a deeper dive into the topic, check out our dedicated article on the Software Carbon Intensity (SCI) standard and how it enables consistent CO₂ assessments for software.
Also recommended: our article series on Embodied Carbon, which explores the hidden emissions in the hardware lifecycle – a crucial counterpart to the software perspective.